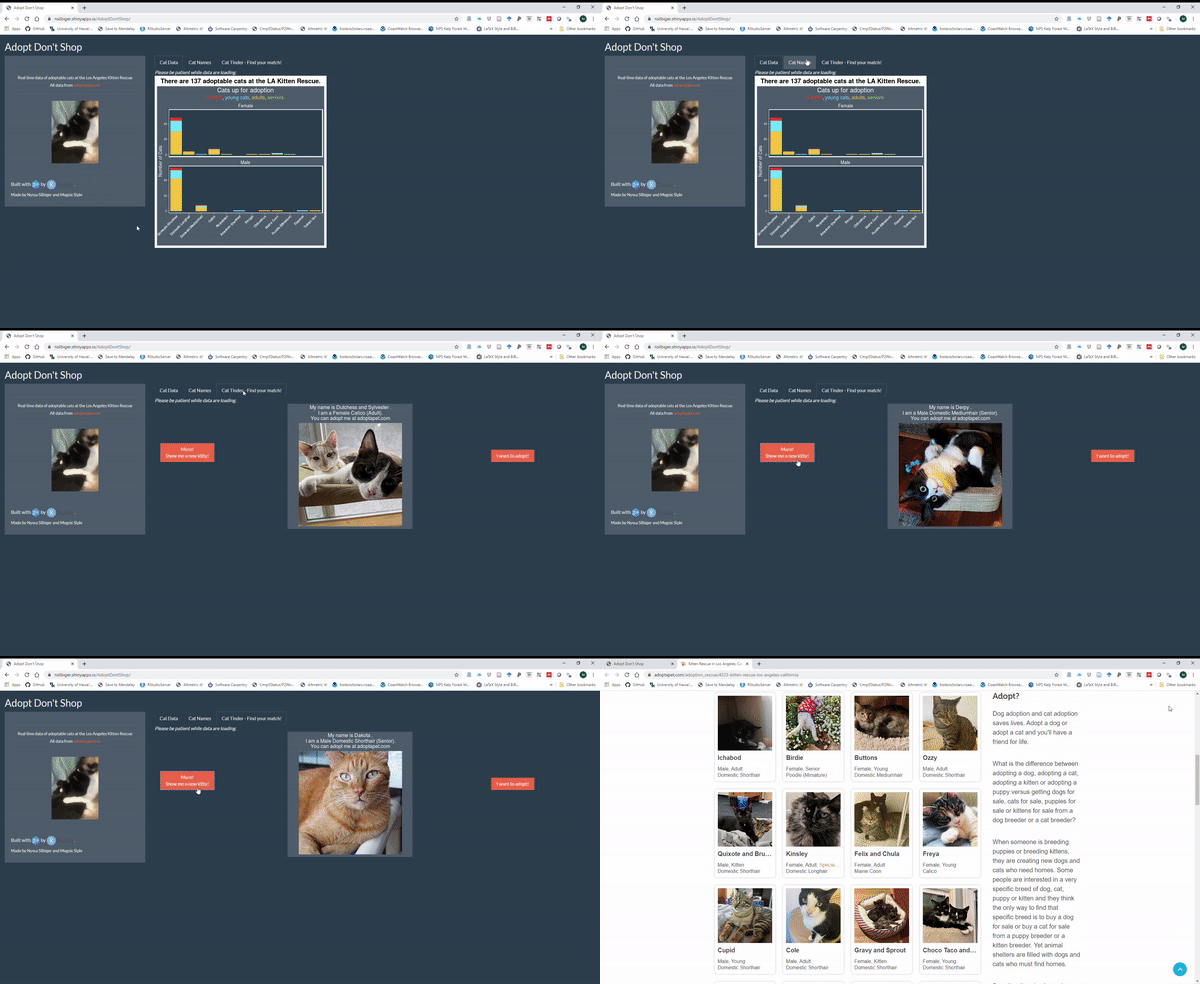
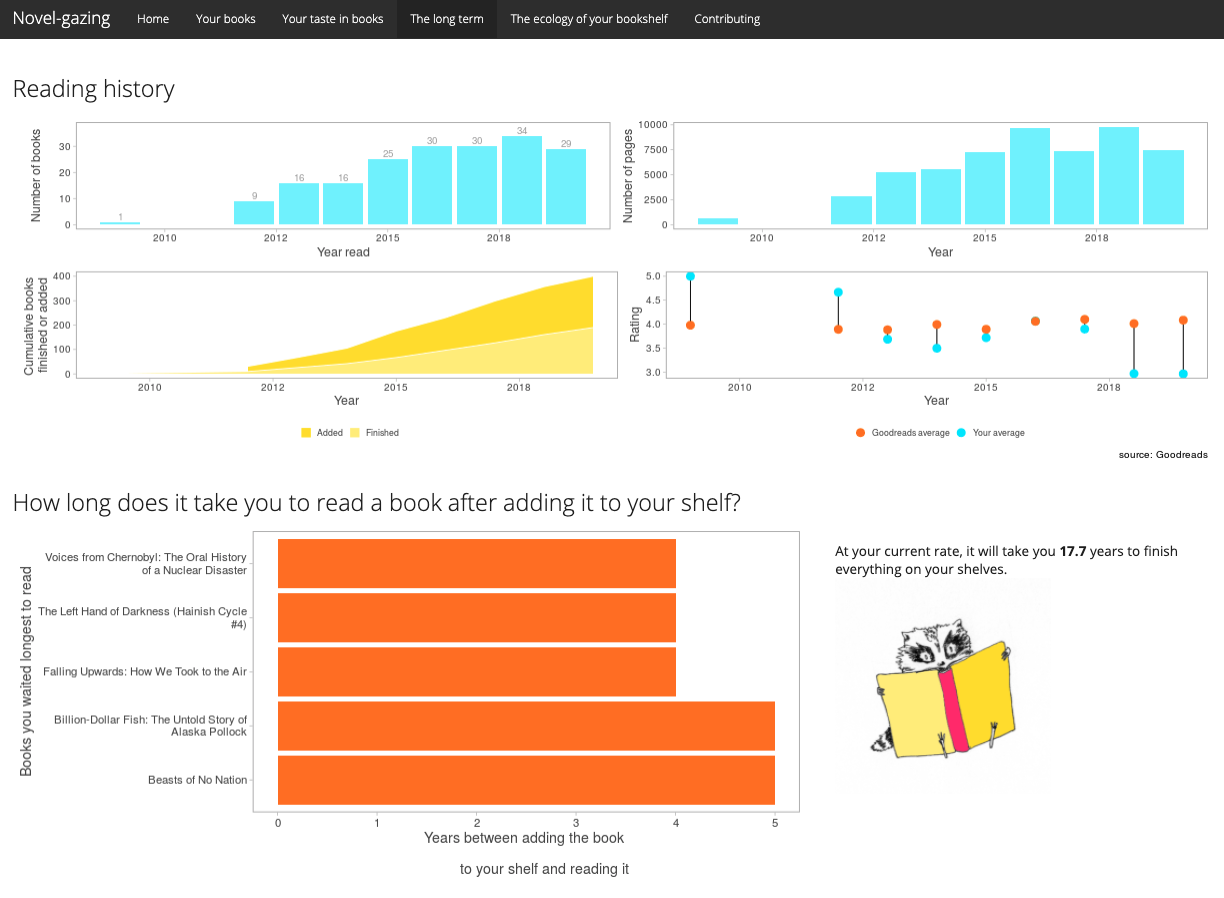
class: center, middle, inverse, title-slide .title[ # Shiny Part 2: Handing data in Shiny & making maps with leaflet ] .subtitle[ ## <br/>FISH 549 ] .author[ ### Megsie Siple ] .institute[ ### NOAA AFSC - RACE/GAP ] .date[ ### 2025-03-05 (updated: 2025-03-05) ] --- # On Monday we talked about - Shiny: when should we use it? - How to build a basic Shiny app --- # Today (Wednesday) we will cover - More basic shiny principles: reactive elements, using modules, etc. - Building interactive maps with `{leaflet}` (shiny code example: *website/lectures/week_09/mapExample/*) -- - ...and we will look at some cool apps. --- class: center, middle, inverse # More Shiny basics --- # Inputs and outputs Most used input widgets: `checkboxInput()` (and `checkboxGroupInput()` allows multiple checkboxes) `radioButtons()` `actionButton()` `sliderInput()` `fileInput()` for uploading files - very helpful! `dateInput()` and `dateRangeInput()` for selecting dates --- # Inputs and outputs Most used output widgets: `plotOutput()` can be any kind of plot, includes ggplot objects `tableOutput()` `textOutput()` `uiOutput()` allows you to dynamically generate user interface components --- # Use `"showcase"` mode to show code and output side by side This option is really useful for teaching people about functionality. ``` r runApp("MyApp", display.mode = "normal") # the default runApp("MyApp", display.mode = "showcase") # shows server code alongside the ui ``` <!--  --> An example I've referred to for teaching: [K-means clustering](https://shiny.posit.co/r/gallery/start-simple/kmeans-example/), from Posit's Shiny gallery. --- # Clean up Shiny code with modules - Modules are like the Shiny equivalent of functions - You can use modules on the server side or the UI --- # Clean up Shiny code with modules .pull-left[ Here is the existing shiny code for a "basic" shiny app that draws a histogram. ``` r ui <- fluidPage( selectInput("var", "Variable", names(mtcars)), numericInput("bins", "bins", 10, min = 1), plotOutput("hist") ) server <- function(input, output, session) { data <- reactive(mtcars[[input$var]]) output$hist <- renderPlot({ hist(data(), breaks = input$bins, main = input$var) }, res = 96) } ``` ] .pull-right[ And you can turn the whole UI into a function output with something like this. `NS()` means namespace. ``` r histogramUI <- function(id) { tagList( selectInput(NS(id, "var"), "Variable", choices = names(mtcars)), numericInput(NS(id, "bins"), "bins", value = 10, min = 1), plotOutput(NS(id, "hist")) ) } ``` ] --- # Write informative error messages with `validate()` and the `shinyFeedback` pkg ``` r validate( need(input$data != "", "Please select a data set") ) ``` More here: https://shiny.posit.co/r/articles/improve/validation/ --- # Maps in Shiny with `leaflet` Leaflet is an open-source JavaScript library that makes interactive maps. It's *cool*! And the [`leaflet`](https://rstudio.github.io/leaflet/articles/leaflet.html) R package integrates well with Markdown files and Shiny apps so you can show spatial data in an interactive way. It gets fancy very fast. <img src="img/new_leaflet_example.jpeg" width="4228" style="display: block; margin: auto;" /> --- # Normal `leaflet` plots .pull-left[`leaflet` code builds plots in layers, similar to visualization tools like `ggplot2`. You build an interactive map by element: ``` r library(leaflet) leaflet() |> addTiles() |> setView( -122.31637, 47.65316, zoom = 17) # set the starting view ``` ] .pull-right[ <div class="leaflet html-widget html-fill-item" id="htmlwidget-84e73670ec59411723f6" style="width:504px;height:504px;"></div> <script type="application/json" data-for="htmlwidget-84e73670ec59411723f6">{"x":{"options":{"crs":{"crsClass":"L.CRS.EPSG3857","code":null,"proj4def":null,"projectedBounds":null,"options":{}}},"calls":[{"method":"addTiles","args":["https://{s}.tile.openstreetmap.org/{z}/{x}/{y}.png",null,null,{"minZoom":0,"maxZoom":18,"tileSize":256,"subdomains":"abc","errorTileUrl":"","tms":false,"noWrap":false,"zoomOffset":0,"zoomReverse":false,"opacity":1,"zIndex":1,"detectRetina":false,"attribution":"© <a href=\"https://openstreetmap.org/copyright/\">OpenStreetMap<\/a>, <a href=\"https://opendatacommons.org/licenses/odbl/\">ODbL<\/a>"}]}],"setView":[[47.65316,-122.31637],17,[]]},"evals":[],"jsHooks":[]}</script> ] --- # And you can customize with different tiles and styles .pull-left[ Map code: ``` r library(leaflet) leaflet() |> addTiles(urlTemplate = "https://{s}.tile.openstreetmap.fr/hot/{z}/{x}/{y}.png") |> setView( -122.31637, 47.65316, zoom = 17) # set the starting view ``` ] .pull-right[ <div class="leaflet html-widget html-fill-item" id="htmlwidget-0ae6d5cb9ea319fa4fb9" style="width:504px;height:504px;"></div> <script type="application/json" data-for="htmlwidget-0ae6d5cb9ea319fa4fb9">{"x":{"options":{"crs":{"crsClass":"L.CRS.EPSG3857","code":null,"proj4def":null,"projectedBounds":null,"options":{}}},"calls":[{"method":"addTiles","args":["https://{s}.tile.openstreetmap.fr/hot/{z}/{x}/{y}.png",null,null,{"minZoom":0,"maxZoom":18,"tileSize":256,"subdomains":"abc","errorTileUrl":"","tms":false,"noWrap":false,"zoomOffset":0,"zoomReverse":false,"opacity":1,"zIndex":1,"detectRetina":false}]}],"setView":[[47.65316,-122.31637],16,[]]},"evals":[],"jsHooks":[]}</script> ] --- # Demo: mackerel eggs Basic leaflet code (no shiny yet) has this 'layered' style: ``` r library(leaflet) library(gamair) # mack dataset (mackerel eggs) data(mack) x <- mack fishpal <- RColorBrewer::brewer.pal(6, name = "YlOrRd") dat2plot <- mack |> dplyr::filter(egg.dens > 0 & !is.na(vessel)) * leaflet(data = dat2plot) |> * addTiles() |> * addCircleMarkers( * ~lon, ~lat, * radius = ~ egg.dens / 30, * color = ~ fishpal, * stroke = FALSE, * fillOpacity = 0.5 * ) |> * addProviderTiles("Esri.WorldImagery") ``` --- # Demo: mackerel eggs <div class="leaflet html-widget html-fill-item" id="htmlwidget-3478eb34b53042609f67" style="width:504px;height:504px;"></div> <script type="application/json" data-for="htmlwidget-3478eb34b53042609f67">{"x":{"options":{"crs":{"crsClass":"L.CRS.EPSG3857","code":null,"proj4def":null,"projectedBounds":null,"options":{}}},"calls":[{"method":"addTiles","args":["https://{s}.tile.openstreetmap.org/{z}/{x}/{y}.png",null,null,{"minZoom":0,"maxZoom":18,"tileSize":256,"subdomains":"abc","errorTileUrl":"","tms":false,"noWrap":false,"zoomOffset":0,"zoomReverse":false,"opacity":1,"zIndex":1,"detectRetina":false,"attribution":"© <a href=\"https://openstreetmap.org/copyright/\">OpenStreetMap<\/a>, <a href=\"https://opendatacommons.org/licenses/odbl/\">ODbL<\/a>"}]},{"method":"addCircleMarkers","args":[[44.02,44.02,44.02,44.02,44.12,44.12,44.37,44.37,44.62,44.87,44.87,45.12,45.12,45.12,45.12,45.12,45.12,45.37,45.62,45.62,45.3,45.23,45.23,45.25,45.25,45.25,45.37,45.37,45.37,45.37,45.37,45.37,45.37,45.52,45.62,45.62,45.62,45.62,45.62,45.62,45.62,45.62,45.62,45.62,45.62,45.62,45.62,45.87,45.87,45.87,45.87,45.87,45.87,45.87,45.87,45.87,45.87,45.87,46.12,46.12,46.12,46.12,46.12,46.12,46.12,46.12,46.12,46.08,46.12,46.37,46.37,46.37,46.37,46.37,46.37,46.52,46.62,46.62,46.62,46.62,46.62,46.62,46.62,46.62,46.62,46.62,46.62,46.62,46.62,46.62,48.25,48.25,48.23,48.25,48.25,48.27,48.23,48.25,48.23,48.25,48.25,48.25,48.23,48.73,48.73,48.73,48.75,48.75,48.73,48.75,48.73,48.73,48.75,48.75,48.75,48.75,48.75,48.73,48.73,48.75,48.75,48.75,48.75,48.75,49.25,49.25,49.25,49.25,49.25,49.25,49.25,49.25,49.23,49.25,49.25,49.25,49.25,49.23,49.25,49.23,49.25,49.25,49.25,49.73,49.73,49.75,49.73,49.73,49.75,49.75,49.75,49.75,49.73,49.73,49.73,49.75,49.75,49.75,49.73,50.25,50.25,50.25,50.25,50.23,50.23,50.23,50.23,50.23,50.23,50.25,50.25,50.23,50.75,50.73,50.75,50.73,50.75,50.73,50.73,50.73,50.75,50.75,50.73,50.73,51.25,51.23,51.25,51.25,51.23,51.23,51.25,51.23,51.23,51.25,51.25,51.25,51.23,51.75,51.73,51.73,51.75,51.73,51.73,51.73,51.73,51.75,51.75,51.73,51.75,51.73,51.73,51.75,51.75,51.23,51.25,51.25,51.25,51.23,51.25,51.25,51.23,51.73,51.75,51.73,51.73,51.73,51.75,51.73,51.73,51.75,51.75,52.23,52.25,52.23,52.25,52.25,52.25,52.23,52.23,52.25,52.73,52.75,52.75,52.73,52.73,52.75,52.75,52.73,53.22,53.25,53.23,53.25,53.23,53.23,53.25,53.25,53.72,53.75,53.75,53.75,53.73,53.73,53.73,53.75,53.75,53.2,52.73,54.25,54.25,54.25,54.23,54.23,54.73,54.75,54.75,54.75,54.75,54.73,55.23,55.25,55.25,55.23,55.23,55.73,55.75,55.73,55.73,55.73,56.25,56.23,56.25,56.23,56.75,56.75,56.73,57.23,57.23,57.25,57.75,57.75,57.75,57.73,56.77,48.25,48.25,48.25,48.25,48.25,48.25,48.25,48.25,48.25,48.25,48.25,48.25,48.25,48.25,48.25,48.25,48.25,48.25,48.25,47.75,47.75,47.75,47.75,47.75,47.75,47.75,47.75,47.75,47.75,47.75,47.75,47.75,47.75,47.25,47.25,47.25,47.25,47.25,47.25,47.25,47.25,47.25,47.25,47.25,46.75,46.75,46.75,46.75,46.75,46.75,46.75,46.75,46.75,46.75,46.75,46.75,46.75,46.75,46.75,46.75,46.25,46.25,46.25,46.25,47.23,47.25],[-2.87,-2.07,-2.13,-2.35,-2.2,-2.07,-2.07,-2.13,-2.07,-2.07,-2.27,-2.98,-2.92,-2.77,-2.63,-2.2,-1.57,-1.98,-2.12,-2.07,-1.35,-1.48,-1.63,-1.7,-1.78,-2.13,-2.48,-2.85,-2.92,-3.05,-3.13,-3.35,-3.42,-4.12,-4.27,-4.2,-4.13,-4.05,-3.85,-3.78,-3.7,-3.63,-3.55,-3.27,-3.2,-3.07,-2.92,-2.07,-2.2,-2.28,-2.98,-3.63,-3.7,-3.85,-3.92,-3.98,-4.07,-4.28,-4.95,-4.58,-4.52,-4.37,-4.3,-4.23,-4.15,-4.02,-3.8,-2.28,-2.22,-3.52,-4.45,-4.53,-4.6,-4.67,-4.73,-5.47,-5.62,-5.55,-5.47,-5.4,-5.33,-5.18,-5.1,-5.03,-4.97,-4.88,-4.82,-4.6,-4.38,-3.95,-5.75,-6.25,-6.8,-7.27,-7.78,-8.23,-8.75,-9.25,-9.75,-10.27,-10.77,-11.25,-11.73,-12.73,-12.25,-11.87,-11.62,-11.37,-11.12,-10.87,-10.62,-10.37,-10.07,-9.85,-9.6,-9.369999999999999,-9.130000000000001,-8.869999999999999,-8.630000000000001,-8.23,-7.75,-7.23,-6.77,-6.27,-6.73,-7.22,-7.72,-8.25,-8.630000000000001,-8.880000000000001,-9.119999999999999,-9.380000000000001,-9.65,-9.880000000000001,-10.15,-10.37,-10.63,-10.88,-11.08,-11.37,-11.73,-12.25,-12.75,-12.73,-12.25,-11.75,-11.33,-11.1,-10.83,-10.6,-10.35,-10.08,-9.85,-9.619999999999999,-9.33,-9.119999999999999,-8.85,-8.6,-7.72,-7.73,-8.73,-9.23,-9.75,-10.1,-10.37,-10.62,-10.87,-11.13,-11.38,-11.73,-12.25,-12.75,-12.75,-12.25,-11.87,-11.6,-11.37,-11.12,-10.85,-10.55,-10.23,-9.720000000000001,-9.23,-8.73,-8.25,-8.75,-9.25,-9.75,-10.25,-10.63,-10.88,-11.3,-11.65,-11.88,-12.12,-12.38,-12.75,-14.73,-14.35,-14.08,-13.85,-13.62,-13.37,-13.12,-12.88,-12.62,-12.38,-12.12,-11.88,-11.62,-11.35,-11.1,-10.73,-8.23,-9.73,-10.23,-10.72,-11.22,-11.72,-12.18,-12.7,-14.7,-14.28,-13.78,-13.28,-12.78,-12.28,-11.77,-11.28,-10.78,-10.3,-10.7,-11.2,-11.7,-12.23,-12.72,-13.2,-13.7,-14.2,-14.68,-14.78,-14.28,-13.78,-13.28,-12.8,-12.28,-11.78,-11.27,-11.25,-11.68,-12.2,-12.7,-13.2,-13.68,-14.2,-14.7,-14.75,-14.28,-13.8,-13.28,-12.77,-12.28,-11.77,-11.3,-10.78,-10.72,-10.27,-10.72,-11.2,-11.73,-12.2,-12.7,-12.27,-11.78,-11.3,-10.78,-10.28,-9.73,-8.699999999999999,-9.220000000000001,-9.720000000000001,-10.18,-10.65,-10.27,-9.779999999999999,-9.27,-8.77,-8.279999999999999,-8.23,-8.720000000000001,-9.199999999999999,-9.68,-9.77,-9.279999999999999,-8.779999999999999,-8.73,-9.18,-9.699999999999999,-9.77,-9.27,-8.779999999999999,-8.279999999999999,-8.25,-5.75,-6.23,-6.75,-7.25,-7.75,-7.8,-8.25,-8.75,-8.800000000000001,-9.23,-9.25,-9.75,-9.77,-10.23,-10.23,-10.73,-10.75,-11.25,-11.73,-10.77,-10.25,-9.75,-9.23,-8.73,-8.27,-8.23,-7.77,-7.75,-7.25,-6.75,-6.27,-5.75,-4.75,-4.73,-6.23,-6.28,-6.75,-7.25,-7.32,-7.73,-8.25,-9.25,-9.73,-10.23,-8.25,-7.75,-7.23,-6.73,-6.25,-6.18,-5.78,-5.73,-5.22,-5.12,-4.77,-4.72,-4.3,-4.27,-3.78,-3.75,-3.25,-3.72,-4.22,-4.28,-4.25,-3.72],[0.6086666666666667,3.005333333333333,2.097666666666667,0.7666666666666667,1.211666666666667,0.6433333333333333,1.957,0.6386666666666667,1.415333333333333,0.7086666666666667,0.6603333333333333,0.732,1.389666666666667,3.121,0.7433333333333334,0.7373333333333334,1.558,0.8423333333333333,0.8186666666666667,2.994,3.101333333333334,0.7766666666666667,1.546,1.71,2.052,0.8079999999999999,0.755,0.7103333333333333,0.7673333333333333,0.6823333333333333,3.593,6.542666666666666,1.575,1.653,3.757,0.7363333333333333,0.6873333333333334,1.523333333333333,0.7070000000000001,0.7826666666666667,0.727,1.363,0.8483333333333333,0.7273333333333334,0.6296666666666667,0.6176666666666667,0.7383333333333333,0.7093333333333334,3.920666666666667,4.952,0.664,0.64,0.675,0.6633333333333333,0.6806666666666668,0.6496666666666666,0.6473333333333334,2.044333333333333,0.648,0.7106666666666667,1.422,12.597,5.003333333333333,3.836333333333334,0.5726666666666667,0.6053333333333334,4.143,1.221,1.375,0.6586666666666667,0.6003333333333334,0.6473333333333334,3.169666666666667,7.336,7.787000000000001,9.808999999999999,0.638,0.743,4.995333333333334,9.096666666666666,1.335333333333333,3.723333333333334,2.754,1.176666666666667,6.603333333333333,0.5263333333333333,10.612,1.237333333333333,1.245666666666666,0.7546666666666667,0.181,0.1066666666666667,0.2013333333333333,0.2596666666666667,0.02733333333333333,0.4993333333333334,1.851,2.095,1.741666666666667,2.306666666666667,1.581666666666667,0.7173333333333333,1.028666666666667,2.516666666666667,0.9723333333333334,1.223,5.037999999999999,5.754333333333333,3.595666666666667,5.960333333333334,4.454,3.875,4.109333333333334,7.110666666666666,4.800333333333333,1.941333333333333,0.4936666666666667,0.06166666666666667,0.1866666666666666,0.2283333333333333,0.174,0.651,0.3456666666666666,0.09133333333333334,0.082,0.239,0.4086666666666667,0.407,0.4623333333333333,0.133,0.03733333333333334,0.3266666666666667,0.2203333333333334,0.27,2.734666666666667,8.485666666666667,4.458333333333333,1.178,2.650666666666667,4.157,11.72933333333333,2.735,4.102666666666667,1.797333333333333,1.872,9.191000000000001,6.816333333333334,1.694333333333333,0.8456666666666667,7.694,0.3656666666666667,1.218333333333333,1.221,1.439333333333333,2.782666666666667,0.1416666666666667,0.1773333333333333,0.134,0.08066666666666666,0.1646666666666667,1.034,1.717,1.687,0.509,0.3083333333333333,0.2976666666666666,0.1863333333333333,5.895333333333334,10.871,8.443,4.079,6.387333333333333,1.550333333333333,2.972,3.315,4.372333333333333,6.763,2.089,1.081333333333333,0.8283333333333334,0.355,0.03966666666666666,0.6873333333333334,0.632,0.02833333333333333,0.06266666666666666,0.02666666666666667,0.05833333333333333,0.186,0.3803333333333334,0.597,1.966,4.275666666666667,10.227,5.030666666666666,4.581666666666666,7.146666666666667,0.4429999999999999,0.7396666666666667,0.9833333333333333,1.985,2.734666666666667,1.464,7.566333333333334,9.612,10.048,4.42,6.761333333333334,4.784666666666666,2.560333333333333,1.636666666666667,0.544,1.060666666666667,0.01866666666666667,0.089,0.6,0.6503333333333334,0.2816666666666666,7.325666666666667,20.05933333333333,4.694999999999999,5.041666666666667,5.22,3.2,11.60266666666667,5.471,9.393666666666666,5.497666666666666,0.4533333333333333,0.346,0.02633333333333333,0.076,0.05433333333333333,1.218666666666667,5.509333333333333,3.122333333333333,5.780666666666666,2.647333333333334,1.197,4.38,12.196,0.6899999999999999,6.779666666666667,2.503666666666667,3.656,1.766333333333333,0.03,0.09733333333333333,0.03233333333333333,0.122,0.2776666666666667,0.9733333333333333,1.718333333333333,1.716,1.270666666666667,3.466666666666667,5.984666666666667,0.9633333333333333,2.496666666666667,1.404,1.403666666666667,0.881,0.7516666666666667,0.3323333333333334,0.6296666666666667,0.02966666666666667,0.06333333333333332,2.802,5.194333333333334,2.322,2.744333333333333,0.7293333333333333,0.423,0.35,0.3803333333333334,7.054333333333333,1.666333333333333,0.7173333333333333,0.02,0.2303333333333333,0.6799999999999999,1.049,0.454,1.170666666666667,1.132,0.751,0.2033333333333333,0.07000000000000001,0.03066666666666667,0.07566666666666667,1.074333333333333,3.092333333333333,0.619,6.296666666666667,0.304,0.1323333333333333,1.385,2.120666666666667,1.843333333333333,0.08699999999999999,0.175,0.06733333333333333,0.022,0.01733333333333333,0.4563333333333333,0.308,0.07366666666666667,0.3056666666666666,0.4873333333333333,0.522,3.118666666666667,2.588666666666667,1.984,1.924,3.959666666666667,2.093333333333333,5.893666666666666,4.441,8.471333333333332,7.572,7.912333333333334,2.501333333333334,0.6716666666666666,0.9296666666666666,0.488,0.6809999999999999,3.169333333333333,4.226,6.321666666666667,5.150333333333333,3.874,0.784,1.406,0.1026666666666667,0.213,0.07000000000000001,0.2836666666666667,0.3726666666666666,0.873,4.214666666666667,2.242333333333333,1.981333333333333,1.047333333333333,0.5489999999999999,0.232,0.148,0.05133333333333333,0.405,0.03166666666666666,0.7213333333333334,1.120333333333333,0.596,0.1673333333333333,1.045666666666667,1.659,2.666333333333333,1.055,0.1923333333333333,0.135,0.1616666666666667,0.167,0.1146666666666667,0.1366666666666667,0.068,0.03266666666666666,0.7696666666666666,0.6903333333333334,0.1676666666666667,0.078],null,null,{"interactive":true,"className":"","stroke":false,"color":["#FFFFB2","#FED976","#FEB24C","#FD8D3C","#F03B20","#BD0026"],"weight":5,"opacity":0.5,"fill":true,"fillColor":["#FFFFB2","#FED976","#FEB24C","#FD8D3C","#F03B20","#BD0026"],"fillOpacity":0.5},null,null,null,null,null,{"interactive":false,"permanent":false,"direction":"auto","opacity":1,"offset":[0,0],"textsize":"10px","textOnly":false,"className":"","sticky":true},null]},{"method":"addProviderTiles","args":["Esri.WorldImagery",null,null,{"errorTileUrl":"","noWrap":false,"detectRetina":false}]}],"limits":{"lat":[44.02,57.75],"lng":[-14.78,-1.35]}},"evals":[],"jsHooks":[]}</script> --- # If you already have a `{leaflet}` script that generates HTML: You can show this code inside a Shiny app with the function `renderLeaflet()` All you have to do is create a leaflet map in your server logic, like so: ``` r * var2plot <- reactive(mack[, input$which_var]) # a reactive expression * output$mymap <- renderLeaflet({ # leaflet object in output data(mack) fishpal <- colorNumeric(RColorBrewer::brewer.pal(6, name = "YlOrRd")) # This is how you call a reactive object in Shiny! * x <- var2plot() dat2plot <- mack |> dplyr::filter(egg.dens > 0 & !is.na(x)) leaflet(data = dat2plot) |> addTiles() |> addCircleMarkers( ~lon, ~lat, radius = ~ egg.dens / 30, color = ~ fishpal, stroke = FALSE, fillOpacity = 0.5 ) |> addProviderTiles("Esri.WorldImagery") }) ``` --- # Corresponding ui.R code ``` r ui <- fluidPage( theme = shinytheme("darkly"), titlePanel("Spatial data in leaflet: Mackerel eggs"), sidebarLayout( sidebarPanel( radioButtons( inputId = "which_var", label = "Which environmental variable to show:", choiceValues = c("salinity", "flow", "temp.surf"), choiceNames = c("Salinity", "Flow", "Surface temperature") ) ), mainPanel( tabsetPanel( tabPanel( "Map", leafletOutput("mymap"), p() ), tabPanel( "Correlation", plotOutput("user_corr") ), tabPanel( "Another map", leafletOutput("new_map") ))))) ``` --- class: center, middle, inverse ## website/lectures/week_09/mapExample --- class: center, middle, inverse # Some cool Shiny apps  --- class: center, middle  Link to the original [AdoptDontShop app](https://forum.posit.co/t/adopt-dont-shop-2020-shiny-contest-submission/59166) (it doesn't work anymore because the shelter changed its interface!) --- class: center, middle  Link to the [Novel-gazing](https://msiple.shinyapps.io/NovelGazingApp/) app. --- class: center, middle # Other Shiny apps of note A cool example of how to use Shiny instead of a lengthy appendix to illustrate a point from a manuscript: [Beyond Temperature](https://heatherwelch.shinyapps.io/beyond_temperature/) by Jennifer McHenry, Heather Welch, Sarah E. Lester, and Vincent Saba An application of Shiny to aggregate data from an API (and get inspiration about data viz): [tidytuesday.rocks](https://nsgrantham.shinyapps.io/tidytuesdayrocks/) by Neal Grantham Use Shiny to provide effective data viz on large datasets: [Sentify](https://rcharlie.shinyapps.io/sentify/) by Charlie Thompson A whole gallery of great apps, complete with source code (and a great way to get recognized for your Shiny work!) All the submissions are [here](https://community.rstudio.com/c/shiny/shiny-contest/30) and the winners from the last contest (2021) are [here](https://posit.co/blog/winners-of-the-3rd-annual-shiny-contest/). --- # Fin #### Today's Shiny-relevant code tips 🍥 `Ctl-P` shortcut jumps to the close parentheses of the statement you're in. Extremely useful for Shiny dev. ☔ You can also enable rainbow parentheses in Global Options by going to `Code --> Display--> Rainbow parentheses` #### contact 📧: margaret.siple@noaa.gov If you're developing a Shiny app for a project, I would love to help you! Send me questions, issues, use code from the `shinyoverview` repo, whatever you want! *** Slides created using the R package [**xaringan**](https://github.com/yihui/xaringan). --- class: center, middle # Extra slides (deployment & getting credit for your Shiny dev work) --- # Deploying your Shiny app ## Deploy to the cloud - Sign up for a free shinyapps.io account - Install `{rsconnect}` - Configure `rsconnect` to use your account using a token from your shinyapps.io account:  --- # Deploying your Shiny app ## Deploy to the cloud - If you add a new token and click 'show', you'll get instructions for how to configure `rsconnect` - Configure your rsconnect installation. This will link your shinyapps.io account to your local environment: ``` r library(rsconnect) setAccountInfo(name="<ACCOUNT>", token="<TOKEN>", secret="<SECRET>")` ``` - You can deploy from within RStudio by clicking the 'Publish' button in the RStudio IDE, or use the console: ``` r deployApp(server = "shinyapps.io")` ``` - woo! --- # Deploying your Shiny app 2 ## Other options for deployment - Deploy to an RStudio Connect account (local, commercial option) - Publish on Shiny Server (local, open source) --- # Getting credit for your Shiny development If you've put a lot of time into making a Shiny app, you should get credit! The publication/credit avenues are unconventional for Shiny apps, but they DO exist. - Publish as a package in an open source software journal (e.g., [JOSS](https://joss.theoj.org/) ) (check out the `{golem}` pkg for structuring your files and streamlining production) 📦 - Publish code straight from GitHub with a DOI from Zenodo ( [here](https://www.rinproduction.com/en/posts/005-8-tips-for-a-production-ready-shiny-application/) are some good tips for preparing your app for production ) - (for "just for fun" apps): submit your Shiny app to the RStudio [Shiny contest](https://community.rstudio.com/t/shiny-contest-2020-is-here/51002) <!-- see if you can get some data on citation rates for JOSS vs zenodo github entry --> ---